15-Ptuh-miRNA-lncRNA-PCC
================
Kathleen Durkin
2025-06-19
- 1 Merge
with miRanda
- 1.1 Match lncRNA IDs to
coordinates
- 1.2 Merge
This code will use Pearson’s correlation coefficient to examine possible
correlations between miRNA and lncRNA expression. This will then be
compared to the miRanda interaction results of the miRNAs and lncRNAs.
Read in miRNA data
``` r
miRNA_counts <- read.delim("../output/03.1-Ptuh-sRNA-summary/Ptuh_miRNA_ShortStack_counts_formatted.txt")
head(miRNA_counts)
```
## sample47 sample48 sample50 sample53 sample57
## Cluster_21 4846 2433 1968 1452 1397
## Cluster_36 39 44 20 41 33
## Cluster_360 142599 101636 141199 84760 52034
## Cluster_390 741 614 748 876 353
## Cluster_757 2201 960 1596 944 621
## Cluster_925 27988 22742 20636 26150 8840
``` r
# Remove any miRNAs with 0 for all samples
miRNA_counts <- miRNA_counts %>%
mutate(Total = rowSums(.[, 1:5]))%>%
filter(!Total==0)%>%
dplyr::select(!Total)
```
``` r
lncRNA_counts<-read_table(file="../../M-multi-species/output/08-lncRNA-features/Ptuh_counts_dedup.txt", skip=1) %>%
rename("lncrna_id"=Geneid,
"sample47"=`../data/ptuh/RNA-POC-47.sorted.bam`,
"sample48"=`../data/ptuh/RNA-POC-48.sorted.bam`,
"sample50"=`../data/ptuh/RNA-POC-50.sorted.bam`,
"sample53"=`../data/ptuh/RNA-POC-53.sorted.bam`,
"sample57"=`../data/ptuh/RNA-POC-57.sorted.bam`)
```
##
## ── Column specification ────────────────────────────────────────────────────────
## cols(
## Geneid = col_character(),
## Chr = col_character(),
## Start = col_double(),
## End = col_double(),
## Strand = col_character(),
## Length = col_double(),
## `../data/ptuh/RNA-POC-47.sorted.bam` = col_double(),
## `../data/ptuh/RNA-POC-48.sorted.bam` = col_double(),
## `../data/ptuh/RNA-POC-50.sorted.bam` = col_double(),
## `../data/ptuh/RNA-POC-53.sorted.bam` = col_double(),
## `../data/ptuh/RNA-POC-57.sorted.bam` = col_double()
## )
``` r
# Change to df
lncRNA_counts_df <- as.data.frame(lncRNA_counts) %>% select(!c("Chr", "Start", "End", "Strand", "Length"))
row.names(lncRNA_counts_df) <- lncRNA_counts_df[,1]
lncRNA_counts_df <- lncRNA_counts_df[,-1] # remove the first column (gene names) if needed
# Remove any lncRNAs with 0 for all samples
lncRNA_counts_df <- lncRNA_counts_df %>%
mutate(Total = rowSums(.[, 1:5]))%>%
filter(!Total==0)%>%
dplyr::select(!Total)
```
Normalize counts
``` r
# Function to normalize counts (simple RPM normalization)
normalize_counts <- function(counts) {
rpm <- t(t(counts) / colSums(counts)) * 1e6
return(rpm)
}
# Normalize miRNA and mRNA counts
miRNA_norm <- normalize_counts(miRNA_counts)
#miRNA_norm <- as.matrix(miRNA_counts_filt)
lncRNA_norm <- normalize_counts(lncRNA_counts_df)
#mRNA_norm <- as.matrix(mRNA_counts_filt)
```
Calculate PCC
``` r
# Function to calculate PCC and p-value for a pair of vectors
calc_pcc <- function(x, y) {
result <- cor.test(x, y, method = "pearson")
return(c(PCC = result$estimate, p_value = result$p.value))
}
# Create a data frame of all miRNA-lncRNA pairs
pairs <- expand.grid(miRNA = rownames(miRNA_norm), lncRNA = rownames(lncRNA_norm))
# Calculate PCC and p-value for each pair
pcc_results <- pairs %>%
rowwise() %>%
mutate(
pcc_stats = list(calc_pcc(miRNA_norm[miRNA,], lncRNA_norm[lncRNA,]))
) %>%
unnest_wider(pcc_stats)
# Adjust p-values for FDR
pcc_results <- pcc_results %>%
mutate(adjusted_p_value = p.adjust(p_value, method = "fdr"))
# filter to significant (p < 0.05) results
pcc_results_sig <- pcc_results %>% filter(p_value < 0.05)
#Save (to avoid needing to rerun the computationally-expensive PCC code)
write.csv(pcc_results, "../output/15-Ptuh-miRNA-lncRNA-PCC/PCC_miRNA_lncRNA.csv")
write.csv(pcc_results_sig, "../output/15-Ptuh-miRNA-lncRNA-PCC/PCC_sig_miRNA_lncRNA.csv")
```
Files too large for Github, so available in large-file storage:
`https://gannet.fish.washington.edu/kdurkin1/ravenbackups/deep-dive-expression/F-Ptuh/output/15-Ptuh-miRNA-lncRNA-PCC/PCC_miRNA_lncRNA.csv`
`https://gannet.fish.washington.edu/kdurkin1/ravenbackups/deep-dive-expression/F-Ptuh/output/15-Ptuh-miRNA-lncRNA-PCC/PCC_sig_miRNA_lncRNA.csv`
Read back in if needed
``` r
pcc_results <- read.csv("https://gannet.fish.washington.edu/kdurkin1/ravenbackups/deep-dive-expression/F-Ptuh/output/15-Ptuh-miRNA-lncRNA-PCC/PCC_miRNA_lncRNA.csv")
pcc_results_sig <- read.csv("https://gannet.fish.washington.edu/kdurkin1/ravenbackups/deep-dive-expression/F-Ptuh/output/15-Ptuh-miRNA-lncRNA-PCC/PCC_sig_miRNA_lncRNA.csv")
```
# 1 Merge with miRanda
Read in miranda data
``` r
miranda_Ptuh <- read.delim("../output/14-Ptuh-miRNA-lncRNA-BLASTs-miRanda/Ptuh-miRanda-lncRNA-strict-parsed.txt", header = F)
colnames(miranda_Ptuh) <- c("miRNA", "lncRNA", "score", "energy", "query_start_end", "subject_start_end", "total_bp_shared", "query_similar", "subject_similar")
```
Format miranda miRNA and lncRNA names
``` r
# miRNA
miranda_Ptuh$miRNA <- sub("^>", "", miranda_Ptuh$miRNA) # Remove leading ">"
miranda_Ptuh$miRNA <- sub("\\..*", "", miranda_Ptuh$miRNA) # Remove everything from the first period onwards
miranda_Ptuh$lncRNA <- sub(".*::", "", miranda_Ptuh$lncRNA) # Remove everything before and including "::"
```
## 1.1 Match lncRNA IDs to coordinates
Now I need to be able to associate the lncRNA IDs used in the count
matrix (e.g., lncRNA_1) with the genomic coordinates used in the fasta
file and miRanda output.
``` r
# Build mapping table
lncRNA_mapping <- data.frame(
lncRNA_id = lncRNA_counts$lncrna_id,
lncRNA_coord = paste0(lncRNA_counts$Chr, ":", lncRNA_counts$Start, "-", lncRNA_counts$End)
)
# Save for future use
write.table(lncRNA_mapping, "../output/15-Ptuh-miRNA-lncRNA-PCC/Ptuh_lncRNA_mapping.tab")
```
## 1.2 Merge
Merge the miranda results with `lncRNA_mapping` to get the associated
lncRNA ids with the transcript info
``` r
miranda_Ptuh_names <- left_join(miranda_Ptuh, lncRNA_mapping, by = c("lncRNA" = "lncRNA_coord")) %>%
select(c(miRNA, lncRNA, score, energy, query_start_end, subject_start_end, total_bp_shared, query_similar, subject_similar, lncRNA_id)) %>%
unique()
```
Now we can merge with the PCC results!
``` r
pcc_miranda_Ptuh <- left_join(miranda_Ptuh_names, pcc_results, by = c("miRNA", "lncRNA_id" = "lncRNA")) %>% unique()
# Write as csv
write.csv(pcc_miranda_Ptuh, "../output/15-Ptuh-miRNA-lncRNA-PCC/miranda_PCC_miRNA_lncRNA.csv")
```
**NOTE: “NA” values in the PCC columns indicates that one of the members
of that miRNA-lncRNA pair had 0 counts in all samples (was completely
unexpressed)**
Inspect the data
``` r
# Read in data again if needed
pcc_miranda_Ptuh <- read.csv("../output/15-Ptuh-miRNA-lncRNA-PCC/miranda_PCC_miRNA_lncRNA.csv")
length(unique(pcc_miranda_Ptuh$miRNA))
```
## [1] 37
``` r
length(unique(pcc_miranda_Ptuh$lncRNA))
```
## [1] 21320
``` r
# Are there any pairs that have a PCC correlation > |0.5| and a p-value < 0.05?
sig_pairs <- pcc_miranda_Ptuh %>%
filter(abs(PCC.cor) > 0.5 & p_value < 0.05)
cat("PCC correlation > |0.5| and a p-value < 0.05:", nrow(sig_pairs), "\n")
```
## PCC correlation > |0.5| and a p-value < 0.05: 1293
``` r
# Are there any pairs that have a PCC correlation > |0.5|, a p-value < 0.05, and a query similarity >75%?
sig_pairs_similar <- pcc_miranda_Ptuh %>%
filter(abs(PCC.cor) > 0.5 & p_value < 0.05 & query_similar > 75.00)
cat("PCC correlation > |0.5| and a p-value < 0.05 and query similarity >75%:", nrow(sig_pairs_similar), "\n")
```
## PCC correlation > |0.5| and a p-value < 0.05 and query similarity >75%: 581
``` r
length(unique(sig_pairs_similar$miRNA))
```
## [1] 37
``` r
length(unique(sig_pairs_similar$lncRNA))
```
## [1] 523
``` r
## Count positive and negative PCC.cor values
positive_count <- sum(sig_pairs_similar$PCC.cor > 0)
negative_count <- sum(sig_pairs_similar$PCC.cor < 0)
cat("Number of rows with positive PCC.cor:", positive_count, "\n")
```
## Number of rows with positive PCC.cor: 351
``` r
cat("Number of rows with negative PCC.cor:", negative_count, "\n")
```
## Number of rows with negative PCC.cor: 230
How many miRNAs per lncRNA and vice versa for the sig pairs? For sig
pairs similar?
``` r
## sig pairs
lncRNAs_per_miRNA <- sig_pairs %>%
group_by(miRNA) %>%
summarize(n_lncRNAs = n_distinct(lncRNA)) %>%
arrange(desc(n_lncRNAs))
print("lncRNAs per miRNA, significant. mean, range:")
```
## [1] "lncRNAs per miRNA, significant. mean, range:"
``` r
mean(lncRNAs_per_miRNA$n_lncRNAs)
```
## [1] 31.86486
``` r
range(lncRNAs_per_miRNA$n_lncRNAs)
```
## [1] 1 129
``` r
cat("\n")
```
``` r
miRNAs_per_lncRNA <- sig_pairs %>%
group_by(lncRNA) %>%
summarize(n_miRNAs = n_distinct(miRNA)) %>%
arrange(desc(n_miRNAs))
print("miRNAs per lncRNA, significnat. mean, range:")
```
## [1] "miRNAs per lncRNA, significnat. mean, range:"
``` r
mean(miRNAs_per_lncRNA$n_miRNAs)
```
## [1] 1.068903
``` r
range(miRNAs_per_lncRNA$n_miRNAs)
```
## [1] 1 3
``` r
cat("\n")
```
``` r
## sig pairs similar
lncRNAs_per_miRNA_sim <- sig_pairs_similar %>%
group_by(miRNA) %>%
summarize(n_lncRNAs = n_distinct(lncRNA)) %>%
arrange(desc(n_lncRNAs))
print("lncRNAs per miRNA, significant and similar. mean, range:")
```
## [1] "lncRNAs per miRNA, significant and similar. mean, range:"
``` r
mean(lncRNAs_per_miRNA_sim$n_lncRNAs)
```
## [1] 14.67568
``` r
range(lncRNAs_per_miRNA_sim$n_lncRNAs)
```
## [1] 1 64
``` r
cat("\n")
```
``` r
miRNAs_per_lncRNA_sim <- sig_pairs_similar %>%
group_by(lncRNA) %>%
summarize(n_miRNAs = n_distinct(miRNA)) %>%
arrange(desc(n_miRNAs))
print("miRNAs per lncRNA, significnat and similar. mean, range:")
```
## [1] "miRNAs per lncRNA, significnat and similar. mean, range:"
``` r
mean(miRNAs_per_lncRNA_sim$n_miRNAs)
```
## [1] 1.038241
``` r
range(miRNAs_per_lncRNA_sim$n_miRNAs)
```
## [1] 1 3
For the significant pairs, the miRNAs can interact with 1-129 unique
lncRNAs, while the lncRNAs can interact with with 1-3 unique miRNAs. For
the significant pairs that have high query similarity, the miRNAs can
interact with 1-64 unique lncRNAs, while the lncRNAs can interact with
1-3 unique miRNAs. These numbers are very similar to the other species!
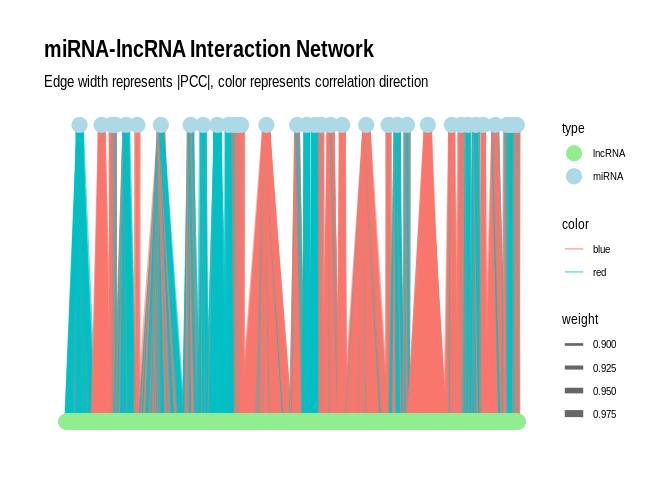
Plot as a network plot with the miRNAs as the primary nodes for
`sig_pairs`
``` r
# Create the graph
g <- graph_from_data_frame(sig_pairs, directed = FALSE)
# Add edge attributes
E(g)$weight <- abs(E(g)$PCC.cor) # Use absolute PCC for edge weight
E(g)$color <- ifelse(E(g)$PCC.cor > 0, "blue", "red") # Blue for positive, red for negative correlations
# Add node attributes
V(g)$type <- ifelse(V(g)$name %in% sig_pairs$miRNA, "miRNA", "lncRNA")
# Convert to tbl_graph for ggraph
g_tbl <- as_tbl_graph(g)
# Create the plot
p <- ggraph(g_tbl, layout = "auto") +
geom_edge_link(aes(edge_width = weight, color = color), alpha = 0.6) +
geom_node_point(aes(color = type), size = 5) +
#geom_node_text(aes(label = name), repel = TRUE, size = 3) +
scale_edge_width(range = c(0.5, 3)) +
scale_color_manual(values = c("miRNA" = "lightblue", "lncRNA" = "lightgreen", "Positive correlation" = "blue", "Negative correlation" = "red")) +
theme_graph() +
labs(title = "miRNA-lncRNA Interaction Network",
subtitle = "Edge width represents |PCC|, color represents correlation direction");p
```
## Using "tree" as default layout
``` r
ggsave("../output/15-Ptuh-miRNA-lncRNA-PCC/Ptuh-significant_miRNA_lncRNA_network.png", p, width = 20, height = 15, dpi = 300)
```
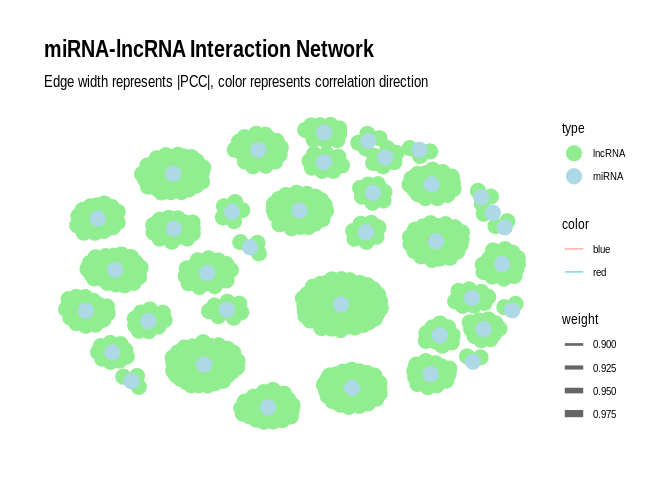
Plot as a network plot with the miRNAs as the primary nodes for
`sig_pairs_similar`
``` r
# Create the graph
g <- graph_from_data_frame(sig_pairs_similar, directed = FALSE)
# Add edge attributes
E(g)$weight <- abs(E(g)$PCC.cor) # Use absolute PCC for edge weight
E(g)$color <- ifelse(E(g)$PCC.cor > 0, "blue", "red") # Blue for positive, red for negative correlations
# Add node attributes
V(g)$type <- ifelse(V(g)$name %in% sig_pairs_similar$miRNA, "miRNA", "lncRNA")
# Convert to tbl_graph for ggraph
g_tbl <- as_tbl_graph(g)
# Create the plot
p <- ggraph(g_tbl, layout = "fr") +
geom_edge_link(aes(edge_width = weight, color = color), alpha = 0.6) +
geom_node_point(aes(color = type), size = 5) +
#geom_node_text(aes(label = name), repel = TRUE, size = 3) +
scale_edge_width(range = c(0.5, 3)) +
scale_color_manual(values = c("miRNA" = "lightblue", "lncRNA" = "lightgreen", "Positive correlation" = "blue", "Negative correlation" = "red")) +
theme_graph() +
labs(title = "miRNA-lncRNA Interaction Network",
subtitle = "Edge width represents |PCC|, color represents correlation direction");p
```
``` r
ggsave("../output/15-Ptuh-miRNA-lncRNA-PCC/Ptuh-similar_significant_miRNA_lncRNA_network.png", p, width = 20, height = 15, dpi = 300)
```