33-Apul-miRNA-mRNA-lncRNA-network
================
Kathleen Durkin
2025-07-16
- 1 All
interactions
- 2 pval < 0.05
- 3 pval < 0.01
- 4 Save
- 5 Using
Cytoscape
- 6
Plotting with igraph
- 6.1 p < 0.05
- 6.2 p , 0.01
Reran 10/14/2025 to incorporate changes due to updated lncRNA counts
matrix
``` r
library(dplyr)
```
##
## Attaching package: 'dplyr'
## The following objects are masked from 'package:stats':
##
## filter, lag
## The following objects are masked from 'package:base':
##
## intersect, setdiff, setequal, union
``` r
library(ggplot2)
library(tidyr)
library(igraph)
```
##
## Attaching package: 'igraph'
## The following object is masked from 'package:tidyr':
##
## crossing
## The following objects are masked from 'package:dplyr':
##
## as_data_frame, groups, union
## The following objects are masked from 'package:stats':
##
## decompose, spectrum
## The following object is masked from 'package:base':
##
## union
``` r
library(ggraph)
library(tidygraph)
```
##
## Attaching package: 'tidygraph'
## The following object is masked from 'package:igraph':
##
## groups
## The following object is masked from 'package:stats':
##
## filter
``` r
knitr::opts_chunk$set(
echo = TRUE, # Display code chunks
eval = TRUE # Evaluate code chunks
)
```
I want to generate an interaction network plot showing the sum of
miRNA-mRNA-lncRNA interactions.
This will include all putative miRNA-mRNA interactions (miRanda +
significant PCC) and all putative miRNA-lncRNA interactions (miRanda +
significant PCC). However, it will *NOT* include mRNA-lncRNA links. This
is for two reasons:
1. First, that dataset is simply too large – there were tens of
millions of mRNA-lncRNA pairs with significantly correlated
expression.
2. Second, the only method we have to investigate potential mRNA-lncRNA
links is expression correlation, which doesn’t provide any
indication of the direction of action and is generally inappropriate
to use as a sole predictor of causative relationships. In contrast,
the miRNA-mRNA and miRNA-lncRNA putative interactions are primarily
supported by binding predictions (through miRanda), and only use
expression correlation as a method of validating interactions and
evaluating their “polarity” (positive or negative relationship).
When making a summary plot, I think it’s only appropriate to include
putative interactions which we can predict with similar degrees of
confidence. Including mRNA-lncRNA interactions in the final plot may
imply we are as confident in those interactions truly existing as we
are in the miRNA-mRNA and miRNA-lncRNA interactions.
Because I’m excluding the mRNA-lncRNA links, I think this will
functionally end up being a putative ceRNA (competative endogenous)
network.
For both `igraph` and `Cytoscape` I need two inputs, an “Edges”
dataframe and a “Nodes” dataframe (both should be saved as `.csv` files
for export to `Cytoscape`.
The “Edges” file should associate each node with all other nodes it
connects to. It should also contain edge-specific metadata. For example:
| source | target | correlation | correlation magnitude | correlation direction | correlation pval | binding pval |
|:---------|:-------|:------------|:----------------------|:----------------------|:-----------------|:-------------|
| miR-100 | FUN001 | -0.9 | 0.9 | -1 | 0.001 | 0.02 |
| miR-100 | FUN002 | 0.85 | 0.85 | 1 | 0.02 | 0.03 |
| lncRNA01 | FUN001 | -0.95 | 0.95 | -1 | 0.01 | 0.01 |
Note that there may be duplicates in both the “source” and “target”
columns, and there may be duplicate source-target combinations if they
have different attributes (e.g. representing different predicted binding
sites of the same pair).However, the rows should be unique.
The “Nodes” file contains metadata for every node included in the plot.
Importantly, the set of nodes listed in the “Nodes” file should match
exactly the set of nodes included in the “Edges” document. For example:
| id | type |
|:---------|:-------|
| FUN001 | gene |
| FUN002 | gene |
| miR-100 | miRNA |
| lncRNA01 | lncRNA |
I’ll need the following files to compile the Cytoscape inputs:
- miRNA-mRNA interaction files (contains binding and coexpression
information for miRNA-gene pairs):
- miRNA-3UTR:
`deep-dive-expression/D-Apul/output/09-Apul-mRNA-miRNA-interactions/miranda_PCC_miRNA_mRNA.csv`
- miRNA-CDS:
`deep-dive-expression/D-Apul/output/09.01-Apul-mRNA-miRNA-interactions-CDS_5UTR/miRanda_PCC_miRNA_CDS.csv`
- miRNA-5UTR:
`deep-dive-expression/D-Apul/output/09.01-Apul-mRNA-miRNA-interactions-CDS_5UTR/miRanda_PCC_miRNA_5UTR.csv`
- miRNA-lncRNA interaction file (contains binding and coexpression
information for miRNA-lncRNA pairs):
- `deep-dive-expression/D-Apul/output/28-Apul-miRNA-lncRNA-interactions/miranda_PCC_miRNA-lncRNA.csv`
Load and format files:
``` r
# Load the three miRNA-mRNA files, and format so they have the same column contents and names
miRNA_3UTR <- read.csv("../output/09-Apul-mRNA-miRNA-interactions/miranda_PCC_miRNA_mRNA.csv") %>% dplyr::select(-X.1, -X)
# Add label for binding region
miRNA_3UTR$region <- "3UTR"
miRNA_CDS <- read.csv("../output/09.01-Apul-mRNA-miRNA-interactions-CDS_5UTR/miRanda_PCC_miRNA_CDS.csv") %>% dplyr::select(-X)
colnames(miRNA_CDS) <- c("miRNA", "mRNA_coord", "score", "energy", "query_start", "query_end", "subject_start", "subject_end", "total_bp_shared", "query_similar", "subject_similar", "mRNA", "PCC.cor", "p_value", "adjusted_p_value")
miRNA_CDS$query_start_end <- paste0(miRNA_CDS$query_start, " ", miRNA_CDS$query_end)
miRNA_CDS$subject_start_end <- paste0(miRNA_CDS$subject_start, " ", miRNA_CDS$subject_end)
# Add label for binding region
miRNA_CDS$region <- "CDS"
# Match column order of miRNA_3UTR
miRNA_CDS <- miRNA_CDS %>% dplyr::select(colnames(miRNA_3UTR))
miRNA_5UTR <- read.csv("../output/09.01-Apul-mRNA-miRNA-interactions-CDS_5UTR/miRanda_PCC_miRNA_5UTR.csv") %>% dplyr::select(-X)
colnames(miRNA_5UTR) <- c("miRNA", "mRNA_coord", "score", "energy", "query_start", "query_end", "subject_start", "subject_end", "total_bp_shared", "query_similar", "subject_similar", "mRNA", "PCC.cor", "p_value", "adjusted_p_value")
miRNA_5UTR$query_start_end <- paste0(miRNA_5UTR$query_start, " ", miRNA_5UTR$query_end)
miRNA_5UTR$subject_start_end <- paste0(miRNA_5UTR$subject_start, " ", miRNA_5UTR$subject_end)
# Add label for binding region
miRNA_5UTR$region <- "5UTR"
# Match column order of miRNA_3UTR
miRNA_5UTR <- miRNA_5UTR %>% dplyr::select(colnames(miRNA_3UTR))
miRNA_gene <- rbind(miRNA_3UTR, miRNA_CDS, miRNA_5UTR)
# Remove NA rows
miRNA_gene <- miRNA_gene %>% filter(!is.na(miRNA))
# Load and format the miRNA-lncRNA file
miRNA_lncRNA <- read.csv("../output/28-Apul-miRNA-lncRNA-interactions/miranda_PCC_miRNA_lncRNA.csv") %>% dplyr::select(-X.1, -X)
# Add label for binding region
miRNA_lncRNA$region <- "lncRNA"
```
For miRNA, annotate with assigned names (e.g., apul-miR-100,
apul-novel-7)
``` r
Apul_names <- read.csv("../../D-Apul/output/11-Apul-sRNA-ShortStack_4.1.0-pulchra_genome/ShortStack_out/Apul_Results_mature_named_miRNAs.csv") %>% dplyr::select(Name, given_miRNA_name)
miRNA_gene <- left_join(miRNA_gene, Apul_names, by = c("miRNA" = "Name"))
miRNA_lncRNA <- left_join(miRNA_lncRNA, Apul_names, by = c("miRNA" = "Name"))
```
# 1 All interactions
Format “Edges” file:
``` r
# Add correlation magnitude and direction columns
miRNA_gene$PCC_magnitude <- abs(miRNA_gene$PCC.cor)
miRNA_gene$PCC_direction <- sign(miRNA_gene$PCC.cor)
miRNA_gene$Alignment <- paste0(miRNA_gene$mRNA, ";", miRNA_gene$query_start_end, ";", miRNA_gene$subject_start_end)
# Select columns I want to keep in Edges file
miRNA_gene_edges <- miRNA_gene %>% dplyr::select(given_miRNA_name, mRNA, region, Alignment, energy, total_bp_shared, query_similar, subject_similar, PCC.cor, PCC_magnitude, PCC_direction, p_value)
# rename columns
miRNA_gene_edges <- miRNA_gene_edges %>% rename(source = given_miRNA_name, target = mRNA)
# Add correlation magnitude and direction columns
miRNA_lncRNA$PCC_magnitude <- abs(miRNA_lncRNA$PCC.cor)
miRNA_lncRNA$PCC_direction <- sign(miRNA_lncRNA$PCC.cor)
miRNA_lncRNA$Alignment <- paste0(miRNA_lncRNA$lncRNA, ";", miRNA_lncRNA$query_start_end, ";", miRNA_lncRNA$subject_start_end)
# Select columns I want to keep in Edges file (ensure in same order as in the miRNA_gene_edges file)
miRNA_lncRNA_edges <- miRNA_lncRNA %>% dplyr::select(given_miRNA_name, lncRNA, region, Alignment, energy, total_bp_shared, query_similar, subject_similar, PCC.cor, PCC_magnitude, PCC_direction, p_value)
# rename columns
miRNA_lncRNA_edges <- miRNA_lncRNA_edges %>% rename(source = given_miRNA_name, target = lncRNA)
# Combine miRNA-gene edges and miRNA-lncRNA edges
edges <- rbind(miRNA_gene_edges, miRNA_lncRNA_edges)
# Ensure we have no duplicate rows
nrow(edges)
```
## [1] 60158
``` r
nrow(edges %>% distinct())
```
## [1] 60122
``` r
# Check formatting/contents
head(edges)
```
## source target region Alignment energy
## 1 apul-mir-novel-9 FUN_028147 3UTR FUN_028147;2 21;185 209 -22.19
## 2 apul-mir-novel-19 FUN_013332 3UTR FUN_013332;2 20;198 220 -23.15
## 3 apul-mir-novel-9 FUN_041253 3UTR FUN_041253;2 21;699 719 -20.50
## 4 apul-mir-novel-28 FUN_010827 3UTR FUN_010827;2 18;346 368 -22.14
## 5 apul-mir-novel-29 FUN_010827 3UTR FUN_010827;2 18;346 368 -22.14
## 6 apul-mir-novel-19 FUN_003342 3UTR FUN_003342;2 20;562 585 -20.65
## total_bp_shared query_similar subject_similar PCC.cor PCC_magnitude
## 1 21 66.67% 71.43% 0.6825537 0.6825537
## 2 19 68.42% 84.21% 0.6371070 0.6371070
## 3 19 73.68% 73.68% -0.2250869 0.2250869
## 4 16 81.25% 93.75% 0.3671005 0.3671005
## 5 16 81.25% 93.75% 0.5369304 0.5369304
## 6 20 65.00% 80.00% 0.1096213 0.1096213
## PCC_direction p_value
## 1 1 0.2041707
## 2 1 0.2476393
## 3 -1 0.7158492
## 4 1 0.5433145
## 5 1 0.3507987
## 6 1 0.8607058
Format Nodes file:
``` r
# Make a df that contains all miRNA, genes, and lncRNA listed in the `source` and `target` columns of `edges`
nodes <- data.frame(
# The `unique` argument ensures we remove duplicates
id = unique(unname(unlist(edges[, c("source", "target")])))
)
# Add column identifying the type of each node (miRNA, lncRNA, or gene)
nodes <- nodes %>%
mutate(type = case_when(
grepl("mir", id) ~ "miRNA",
grepl("FUN", id) ~ "gene",
grepl("lncRNA", id) ~ "lncRNA",
TRUE ~ "other"
))
# Check formatting/contents
head(nodes)
```
## id type
## 1 apul-mir-novel-9 miRNA
## 2 apul-mir-novel-19 miRNA
## 3 apul-mir-novel-28 miRNA
## 4 apul-mir-novel-29 miRNA
## 5 apul-mir-2023 miRNA
## 6 apul-mir-novel-27 miRNA
# 2 pval \< 0.05
Edges:
``` r
edges_pval_0.05 <- edges %>% filter(p_value < 0.05)
nrow(edges_pval_0.05)
```
## [1] 2786
Nodes:
``` r
# Make a df that contains all miRNA, genes, and lncRNA listed in the `source` and `target` columns of `edges`
nodes_pval_0.05 <- data.frame(
# The `unique` argument ensures we remove duplicates
id = unique(unname(unlist(edges_pval_0.05[, c("source", "target")])))
)
# Add column identifying the type of each node (miRNA, lncRNA, or gene)
nodes_pval_0.05 <- nodes_pval_0.05 %>%
mutate(type = case_when(
grepl("mir", id) ~ "miRNA",
grepl("FUN", id) ~ "gene",
grepl("lncRNA", id) ~ "lncRNA",
TRUE ~ "other"
))
nrow(nodes_pval_0.05)
```
## [1] 2302
``` r
nrow(filter(nodes_pval_0.05, type=="miRNA"))
```
## [1] 39
``` r
nrow(filter(nodes_pval_0.05, type=="gene"))
```
## [1] 1821
``` r
nrow(filter(nodes_pval_0.05, type=="lncRNA"))
```
## [1] 442
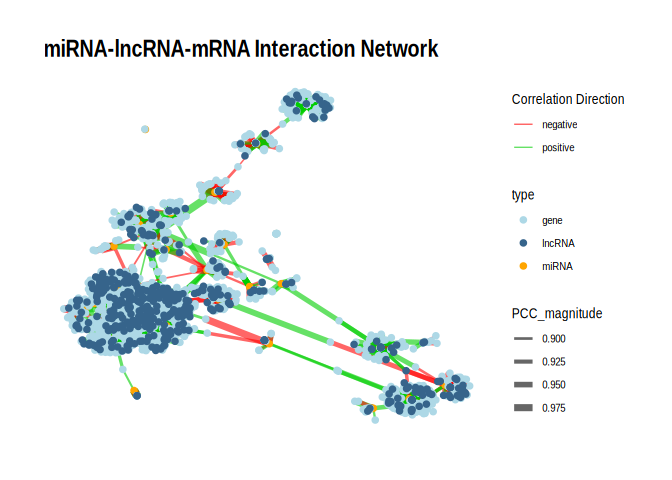
When using a PCC significance level of 0.05, there are 2786 edges and
2302 nodes. In other words, 2302 features (39 miRNA, 1821 mRNA, and 442
lncRNA) form 2786 pairwise interactions based on both putative binding
and expression correlation.
Some more summary stats: Keep in mind that there may be multiple
predicted interactions between a single feature pair (e.g. a single
miRNA-mRNA pair), since there may be multiple viable binding sites. One
must consider both interaction-level and unique feature level (e.g. An
miRNA may target 15 unique mRNAs via 20 putative interactions)
``` r
# Helper function to summarize counts
summarize_counts <- function(df, group_col) {
df %>%
count({{ group_col }}) %>%
summarise(
mean = signif(mean(n), 3),
median = signif(median(n), 3),
min = min(n),
max = max(n)
)
}
network_summary_stats <- function(edges_df) {
# Separate mRNA and lncRNA edges
mRNA_edges <- edges_df %>% filter(region %in% c("3UTR", "5UTR", "CDS"))
lncRNA_edges <- edges_df %>% filter(region == "lncRNA")
# ---- For miRNAs ----
# mRNA interactions (all and unique)
mRNA_int_all <- summarize_counts(mRNA_edges, source)
mRNA_int_unique <- summarize_counts(distinct(mRNA_edges, source, target), source)
# lncRNA interactions (all and unique)
lncRNA_int_all <- summarize_counts(lncRNA_edges, source)
lncRNA_int_unique <- summarize_counts(distinct(lncRNA_edges, source, target), source)
# ---- For targets ----
# miRNA interactions on mRNA (all and unique)
miRNA_int_mRNA_all <- summarize_counts(mRNA_edges, target)
miRNA_int_mRNA_unique <- summarize_counts(distinct(mRNA_edges, source, target), target)
# miRNA interactions on lncRNA (all and unique)
miRNA_int_lncRNA_all <- summarize_counts(lncRNA_edges, target)
miRNA_int_lncRNA_unique <- summarize_counts(distinct(lncRNA_edges, source, target), target)
# ---- Proportion of mRNA targets per miRNA ----
# Unique target level
miRNA_target_mRNA_prop_unique <- edges_df %>%
mutate(type = ifelse(region %in% c("CDS", "3UTR", "5UTR"), "mRNA", "lncRNA")) %>%
distinct(source, target, type) %>% # Keep unique miRNA–mRNA or miRNA-lncRNA pairs
group_by(source, type) %>%
summarise(count = n(), .groups = "drop") %>%
group_by(source) %>%
mutate(prop = count / sum(count)) %>%
filter(type == "mRNA") %>% # Keep only mRNA proportions
ungroup() %>%
summarise(
mean = signif(mean(prop), 3),
median = signif(median(prop), 3),
min = signif(min(prop), 3),
max = signif(max(prop), 3)
)
# ---- Combine into summary table ----
summary_stats <- bind_rows(
mRNA_int_all %>% mutate(Metric = "mRNA interactions per miRNA (all)"),
mRNA_int_unique %>% mutate(Metric = "mRNA targets per miRNA (unique)"),
lncRNA_int_all %>% mutate(Metric = "lncRNA interactions per miRNA (all)"),
lncRNA_int_unique %>% mutate(Metric = "lncRNA targets per miRNA (unique)"),
miRNA_int_mRNA_all %>% mutate(Metric = "miRNA interactions per mRNA (all)"),
miRNA_int_mRNA_unique %>% mutate(Metric = "miRNAs per mRNA (unique)"),
miRNA_int_lncRNA_all %>% mutate(Metric = "miRNA interactions per lncRNA (all)"),
miRNA_int_lncRNA_unique %>% mutate(Metric = "miRNAs per lncRNA (unique)"),
miRNA_target_mRNA_prop_unique %>% mutate(Metric = "Prop. mRNA targets per miRNA (unique)")
) %>%
select(Metric, everything())
return(summary_stats)
}
network_summary_stats(edges_pval_0.05)
```
## Metric mean median min max
## 1 mRNA interactions per miRNA (all) 57.000 43.000 1.000 199
## 2 mRNA targets per miRNA (unique) 51.000 39.000 1.000 193
## 3 lncRNA interactions per miRNA (all) 15.700 8.000 1.000 74
## 4 lncRNA targets per miRNA (unique) 13.500 7.500 1.000 61
## 5 miRNA interactions per mRNA (all) 1.220 1.000 1.000 75
## 6 miRNAs per mRNA (unique) 1.090 1.000 1.000 6
## 7 miRNA interactions per lncRNA (all) 1.280 1.000 1.000 11
## 8 miRNAs per lncRNA (unique) 1.100 1.000 1.000 5
## 9 Prop. mRNA targets per miRNA (unique) 0.826 0.803 0.625 1
**At the interaction-level (which allows for multiple interactions
between a single feature pair):** Each miRNA has 57 interactions with
mRNA and 15.7 interactions with lncRNA, on average, though there is
quite a bit of variability. Each mRNA has an average of 1.2 interactions
with miRNA, and each lncRNA has an average of 1.3 interactions with
miRNA.
**At the unique-feature level:** On average, each miRNA has 51 unique
mRNA targets and 13.5 unique lncRNA targets, though again there is a lot
of variation. Both mRNA and lncRNA are targeted by 1.1 unique miRNA, on
average.
Additionally, there is some variation in the relative proportion of
miRNA targets that are mRNA. However, unlike in P.tuh, which had some
lncRNA-dominant modules, all miRNA modules are dominated by mRNA, with
relative proportions ranging from 62.5% mRNA to 100%, with a mean of
82.6%.
# 3 pval \< 0.01
Edges:
``` r
edges_pval_0.01 <- edges %>% filter(p_value < 0.01)
nrow(edges_pval_0.01)
```
## [1] 660
Nodes:
``` r
# Make a df that contains all miRNA, genes, and lncRNA listed in the `source` and `target` columns of `edges`
nodes_pval_0.01 <- data.frame(
# The `unique` argument ensures we remove duplicates
id = unique(unname(unlist(edges_pval_0.01[, c("source", "target")])))
)
# Add column identifying the type of each node (miRNA, lncRNA, or gene)
nodes_pval_0.01 <- nodes_pval_0.01 %>%
mutate(type = case_when(
grepl("mir", id) ~ "miRNA",
grepl("FUN", id) ~ "gene",
grepl("lncRNA", id) ~ "lncRNA",
TRUE ~ "other"
))
nrow(nodes_pval_0.01)
```
## [1] 624
``` r
nrow(filter(nodes_pval_0.01, type=="miRNA"))
```
## [1] 39
``` r
nrow(filter(nodes_pval_0.01, type=="gene"))
```
## [1] 467
``` r
nrow(filter(nodes_pval_0.01, type=="lncRNA"))
```
## [1] 118
When using a PCC significance level of 0.01, there are 660 edges and 624
nodes. In other words, 2302 features (39 miRNA, 467 mRNA, and 118
lncRNA) form 2786 pairwise interactions based on both putative binding
and expression correlation.
Some more summary stats: Keep in mind that there may be multiple
predicted interactions between a single feature pair (e.g. a single
miRNA-mRNA pair), since there may be multiple viable binding sites. One
must consider both interaction-level and unique feature level (e.g. An
miRNA may target 15 unique mRNAs via 20 putative interactions)
``` r
network_summary_stats(edges_pval_0.01)
```
## Metric mean median min max
## 1 mRNA interactions per miRNA (all) 12.900 8.000 1.000 70
## 2 mRNA targets per miRNA (unique) 12.400 8.000 1.000 64
## 3 lncRNA interactions per miRNA (all) 5.960 3.500 1.000 30
## 4 lncRNA targets per miRNA (unique) 4.730 3.000 1.000 16
## 5 miRNA interactions per mRNA (all) 1.080 1.000 1.000 6
## 6 miRNAs per mRNA (unique) 1.030 1.000 1.000 3
## 7 miRNA interactions per lncRNA (all) 1.310 1.000 1.000 6
## 8 miRNAs per lncRNA (unique) 1.040 1.000 1.000 5
## 9 Prop. mRNA targets per miRNA (unique) 0.819 0.825 0.333 1
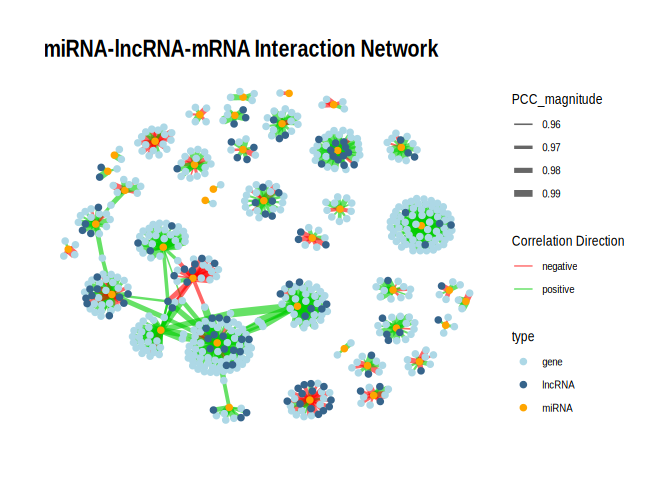
**At the interaction-level (which allows for multiple interactions
between a single feature pair):** Each miRNA has 12.9 interactions with
mRNA and 6.0 interactions with lncRNA, on average, though there is quite
a bit of variability. Each mRNA has an average of 1.1 interactions with
miRNA, and each lncRNA has an average of 1.3 interactions with miRNA.
**At the unique-feature level:** On average, each miRNA has 12.4 unique
mRNA targets and 4.7 unique lncRNA targets, though again there is a bit
of variation. Both mRNA and lncRNA are targeted by 1.0 unique miRNA, on
average.
Additionally, there is variation in the relative proportion of miRNA
targets that are mRNA, and this variation is notably higher than our
Apul network at the 0.05 significance level. Relative mRNA proportion
ranges from 33.3% (lncRNA-dominant) to 100% (mRNA-dominant), with an
average of 81.9% (mRNA-dominant)
# 4 Save
Save files
``` r
write.csv(edges_pval_0.05, "../output/33-Apul-miRNA-mRNA-lncRNA-network/edges_miRNA_mRNA_lncRNA_network_p0.05.csv", quote = FALSE)
write.csv(nodes_pval_0.05, "../output/33-Apul-miRNA-mRNA-lncRNA-network/nodes_miRNA_mRNA_lncRNA_network_p0.05.csv", quote = FALSE)
write.csv(edges_pval_0.01, "../output/33-Apul-miRNA-mRNA-lncRNA-network/edges_miRNA_mRNA_lncRNA_network_p0.01.csv", quote = FALSE)
write.csv(nodes_pval_0.01, "../output/33-Apul-miRNA-mRNA-lncRNA-network/nodes_miRNA_mRNA_lncRNA_network_p0.01.csv", quote = FALSE)
```
# 5 Using Cytoscape
To load a network into Cytoscape:
1. Open Cytoscape and select File \> Import \> Network from File…
2. Select “Edges” file. Ensure The source and target columns are
appropriately identified before loading the file.
3. To load “Nodes” file, select File \> Import \> Table from File…
# 6 Plotting with igraph
## 6.1 p \< 0.05
``` r
# Rename columns for igraph
colnames(edges_pval_0.05)[1:2] <- c("from", "to") # For igraph edge input
colnames(nodes_pval_0.05)[1] <- "name" # For igraph vertex input; must match nodes in edges
# Build graph
g <- graph_from_data_frame(d = edges_pval_0.05, vertices = nodes_pval_0.05, directed = FALSE)
# Edge attributes
E(g)$edge_color <- ifelse(E(g)$PCC_direction > 0, "positive", "negative")
# Convert to tbl_graph
g_tbl <- as_tbl_graph(g)
p <- ggraph(g_tbl, layout = "fr") +
geom_edge_link(aes(edge_width = PCC_magnitude, color = edge_color), alpha = 0.6) +
geom_node_point(aes(color = type), size = 2) +
scale_edge_width(range = c(0.5, 3)) +
# Split color scales
scale_edge_color_manual(
values = c("positive" = "green3", "negative" = "red"),
name = "Correlation Direction"
) +
scale_color_manual(
values = c("miRNA" = "orange", "gene" = "lightblue", "lncRNA" = "steelblue4"),
name = "type"
) +
theme_graph() +
labs(title = "miRNA-lncRNA-mRNA Interaction Network")
print(p)
```
## 6.2 p , 0.01
``` r
# Rename columns for igraph
colnames(edges_pval_0.01)[1:2] <- c("from", "to") # For igraph edge input
colnames(nodes_pval_0.01)[1] <- "name" # For igraph vertex input; must match nodes in edges
# Build graph
g <- graph_from_data_frame(d = edges_pval_0.01, vertices = nodes_pval_0.01, directed = FALSE)
# Edge attributes
E(g)$edge_color <- ifelse(E(g)$PCC_direction > 0, "positive", "negative")
# Convert to tbl_graph
g_tbl <- as_tbl_graph(g)
p <- ggraph(g_tbl, layout = "fr") +
geom_edge_link(aes(edge_width = PCC_magnitude, color = edge_color), alpha = 0.6) +
geom_node_point(aes(color = type), size = 2) +
scale_edge_width(range = c(0.5, 3)) +
# Split color scales
scale_edge_color_manual(
values = c("positive" = "green3", "negative" = "red"),
name = "Correlation Direction"
) +
scale_color_manual(
values = c("miRNA" = "orange", "gene" = "lightblue", "lncRNA" = "steelblue4"),
name = "type"
) +
theme_graph() +
labs(title = "miRNA-lncRNA-mRNA Interaction Network")
print(p)
```