The formats actually available in a given Graphviz system depend on how the system was built and the presence of additional libraries. To see what formats dot supports, run dot -T?. See the description of the -T flag for additional information.
Note that the internal coordinate system has the origin in the lower left corner. Thus, positions in the canon, dot, xdot, plain, and plain-ext formats need to be interpreted in this manner.
| Command-line parameter | Format |
|---|---|
| bmp | Windows Bitmap Format |
| canon
dot gv xdot xdot1.2 xdot1.4 | DOT |
| cgimage | CGImage bitmap format |
| cmap | Client-side imagemap (deprecated) |
| eps | Encapsulated PostScript |
| exr | OpenEXR |
| fig | FIG |
| gd
gd2 | GD/GD2 formats |
| gif | GIF |
| gtk | GTK canvas |
| ico | Icon Image File Format |
| imap
cmapx | Server-side and client-side imagemaps |
| imap_np
cmapx_np | Server-side and client-side imagemaps |
| ismap | Server-side imagemap (deprecated) |
| jp2 | JPEG 2000 |
| jpg
jpeg jpe | JPEG |
| json
json0 dot_json xdot_json | Dot graph represented in JSON format |
| pct
pict | PICT |
| Portable Document Format (PDF) | |
| pic | Kernighan's PIC graphics language |
| plain
plain-ext | Simple text format |
| png | Portable Network Graphics format |
| pov | POV-Ray markup language (prototype) |
| ps | PostScript |
| ps2 | PostScript for PDF |
| psd | PSD |
| sgi | SGI |
| svg
svgz | Scalable Vector Graphics |
| tga | Truevision TGA |
| tif
tiff | TIFF (Tag Image File Format) |
| tk | TK graphics |
| vml
vmlz | Vector Markup Language (VML) |
| vrml | VRML |
| wbmp | Wireless BitMap format |
| webp | Image format for the Web |
| xlib
x11 | Xlib canvas |
The dot option corresponds to attributed dot output, and is the default output format. It reproduces the input, along with layout information for the graph. In particular, a bb attribute is attached to the graph, specifying the bounding box of the drawing. If the graph has a label, its position is specified by the lp attribute.
Each node gets pos, width and height attributes. If the node is a record, the record rectangles are given in the rects attribute. If the node is a polygon and the vertices attribute is defined, this attribute contains the vertices of the node.
Every edge is assigned a pos attribute, and if the edge has a label, the label position is given in lp.
The xdot format extends the dot format by providing much more detailed information about how graph components are drawn. It relies on additional attributes for nodes, edges and graphs.
The format is fluid; comments and suggestions for better representations are welcome. To allow for changes in the format, Graphviz attaches the attribute xdotversion to the graph. If the xdotversion attribute is set in the input graph, the renderer will only output features supported by that version. Note that the formats xdot1.2 and xdot1.4 are equivalent to setting xdotversion=1.2 and xdotversion=1.4, respectively.
Additional drawing attributes can appear on nodes, edges, clusters and
on the graph itself. There are six new attributes:
For a given graph object, one will typically a draw directive before the
label directive. For example, for a node, one would first use the commands
in _draw_ followed by the commands in _ldraw_.
The value of these attributes consists of the concatenation of some
(multi-)set of the following 13 rendering or attribute operations.
(The number is parentheses gives the xdot version when the operation
was added to the format. If no version number is given, the operation
was in the original specification.)
Note that the filled figures (ellipses, polygons and B-Splines)
imply two operations: first, drawing the filled figure with the
current fill color; second, drawing an unfilled figure with the
current pen color, pen width and pen style.
Within the context of a single drawing attribute, e.g., _draw_, there is
an implicit state for the graphical attributes. That is, once a color, style, font, or
font characteristic is set, it remains valid for all relevant drawing operations
until the value is reset by another xdot cmd.
Style values which can be incorporated in the graphics model do not
appear in xdot output. In particular, the style values
filled, rounded, diagonals, and invis
will not appear. Indeed, if style contains invis,
there will not be any xdot output at all.
With version 1.4 of xdot, color strings may now encode linear and radial gradients. Linear
gradients have the form
Radial gradients have the form
In handling text alignment, the application may want to recompute the
string width using its own rendering primitives.
The text operation is only used in the label attributes. Normally,
the non-text operations are only used in the non-label attributes.
If, however, the decorate
attribute is set on an edge, its label
attribute will also contain a polyline operation.
In addition, if a label is a complex, HTML-like label, it will also
contain non-text operations.
All coordinates and sizes are in points.
Note though that if
an edge or node is invisible, no drawing operations are attached to it.
Version info:
See Note.
For example, to create a server-side map
given the dot file
URLs can be attached to the root
graph, nodes and edges. If a node has a URL, clicking in the node
will activate the link.
If an edge has a URL, various
points along the edge (but not necessarily the head or tail)
will link to it. In addition, if the edge has a
label, that will link
to the URL.
As for the head of the edge, this is linked to the
headURL, if set.
Otherwise, it is linked to the edge's URL if that is defined.
The analogous description holds for the tail and the
tailURL.
A URL associated with the graph is used as a default link.
If the URL
of a node contains the escape sequence "\N", it will be replaced by
the node's name.
If the headURL is defined and contains the escape sequence "\N",
it will be replaced by
the headlabel, if defined.
The analogous result holds for the tailURL and the
taillabel.
See Note.
The output produced by these follows the json schema shown below.
Note that the objects array has all of the subgraphs first,
followed by all of the nodes. The _gvid value is the index of
the subgraph or node in the objects array. This also holds
true for the edges in the objects array. Note that this format
allows clustered graphs, where edges can connect clusters as well as nodes.
Note: At present, this option does not support anchors, etc. To get these
included in your PDF output, use ps2.
There are four types of statements.
Note: The control points given in an edge statement define the
body of the edge. In particular, if the edge has an arrowhead to the
head or tail node,
there will be a gap between the last or first control points and the
boundary of the associated node. There are at least 3 possible ways
of handling this gap:
Note that the plain formats provide minimal information, really giving not
much more than node positions and sizes, and edge spline control points.
These formats are usually most useful to applications wanting just this
geometric information, and willing to fill in all of the graphical details.
The only real advantages to these formats is their terseness and their
ease of parsing. In general, the dot and
xdot are preferable in terms of the quantity of
information provided.
(25 November 2014) A standard Graphviz installation will render using both
the Cairo and GD library.
By mixing the rendering and formatting of these
libraries, one can achieve different variations in the output.
Note: The default PostScript renderer can only handle the Latin-1
character set. To get non-Latin-1 characters into PostScript output,
use -Tps:cairo, assuming your version was built with the
Cairo renderer.
See Note.
See Note.
Line segments are drawn as cylinders.
In general, VRML output relies on having the PNG library to produce images
used to texture-fill the node shapes. However, if
shape=point,
a node is drawn as a 3D sphere.
_draw_ General drawing without labels
_ldraw_ Label drawing
_hdraw_ Head arrowhead Edge only
_tdraw_ Tail arrowhead Edge only
_hldraw_ Head label Edge only
_tldraw_ Tail label Edge only
E x0 y0 w h
Filled ellipse ((x-x0)/w)2 + ((y-y0)/h)2 = 1
e x0 y0 w h
Unfilled ellipse ((x-x0)/w)2 + ((y-y0)/h)2 = 1
P n x1 y1 ... xn yn
Filled polygon using the given n points
p n x1 y1 ... xn yn
Unfilled polygon using the given n points
L n x1 y1 ... xn yn
Polyline using the given n points
B n x1 y1 ... xn yn
B-spline using the given n control points
b n x1 y1 ... xn yn
Filled B-spline using the given n control points (1.1)
T x y j w n -b1b2...bn
Text drawn using the baseline point (x,y). The text consists of the
n bytes following '-'. The text should be left-aligned (centered,
right-aligned) on the point if j is -1 (0, 1), respectively. The value
w gives the width of the text as computed by the library.
t f
Set font characteristics. The integer f is the OR of BOLD=1, ITALIC=2, UNDERLINE=4, SUPERSCRIPT=8, SUBSCRIPT=16, (1.5) STRIKE-THROUGH=32 (1.6),
and OVERLINE=64 (1.7).
C n -b1b2...bn
Set fill color. The color value consists of the
n bytes following '-'. (1.1)
c n -b1b2...bn
Set pen color. The color value consists of the
n bytes following '-'. (1.1)
F s n -b1b2...bn
Set font. The font size is s points. The font name consists of the
n bytes following '-'. (1.1)
S n -b1b2...bn
Set style attribute. The style value consists of the
n bytes following '-'. The syntax of the value is the same as
specified for a styleItem in style. (1.1)
I x y w h n -b1b2...bn
Externally-specified image drawn in the box with lower left
corner (x,y) and upper right corner (x+w,y+h). The name of the image
consists of the n bytes following '-'. This is usually a bitmap
image. Note that the image size, even when converted from pixels to
points, might be different from the required size (w,h). It is
assumed the renderer will perform the necessary scaling. (1.2)
'[' x0 y0 x1 y1 n [color-stop]+ ']'
where (x0,y0) and (x1,y1) define the starting and
ending points of the gradient line segment, and n gives the number of color-stops. Each
color-stop has the form
v m -b1b2...bm
where v is a number in the range [0,1] defining a position on the gradient line segment, with
color specified by the m byte string b1b2...bm,
the same format as used for colors in the 'c' and 'C' operations.
'(' x0 y0 r0 x1 y1 r1 n [color-stop]+ ')'
where xj yj rj, for j=0,1, specify
the center and radius of the start and ending circle, and n gives the number of color-stops.
A color-stop has the same format as defined for linear gradients, again given the fractional
offset and its associated color.
Xdot version Graphviz version Modification 1.0 1.9 1.1 2.8 First plug-in version 1.2 2.13 Support image operator I 1.3 2.31 Add numerical precision
1.4 2.32 Add gradient colors
1.5 2.34 Fix text layout problem; fix inverted vector in gradient; support version-specific output; new t op for text characteristics
1.6 2.35 Add STRIKE-THROUGH bit for t
1.7 2.37 Add OVERLINE for t
/* x.gv */
digraph mainmap {
  URL="http://www.research.att.com/base.html";
  command [URL="http://www.research.att.com/command.html"];
  command -> output [URL="colors.html"];
}
one would process the graph and generate two output files:
dot -Timap -ox.map -Tgif -ox.gif x.gv
and then refer to it in a web page:
dot -Tcmapx -ox.map -Tgif -ox.gif x.gv
and uses the HTML
 graph scale width height
 node name x y width height label style shape color fillcolor
 edge tail head n x1 y1 .. xn yn [label xl yl] style color
 stop
The output consists of one graph line, a sequence of
node lines, one per node, a sequence of
edge lines, one per edge, and a final stop
line. All units are in inches, represented by a floating point number.
These options are listed in increasing order of image quality and output size.
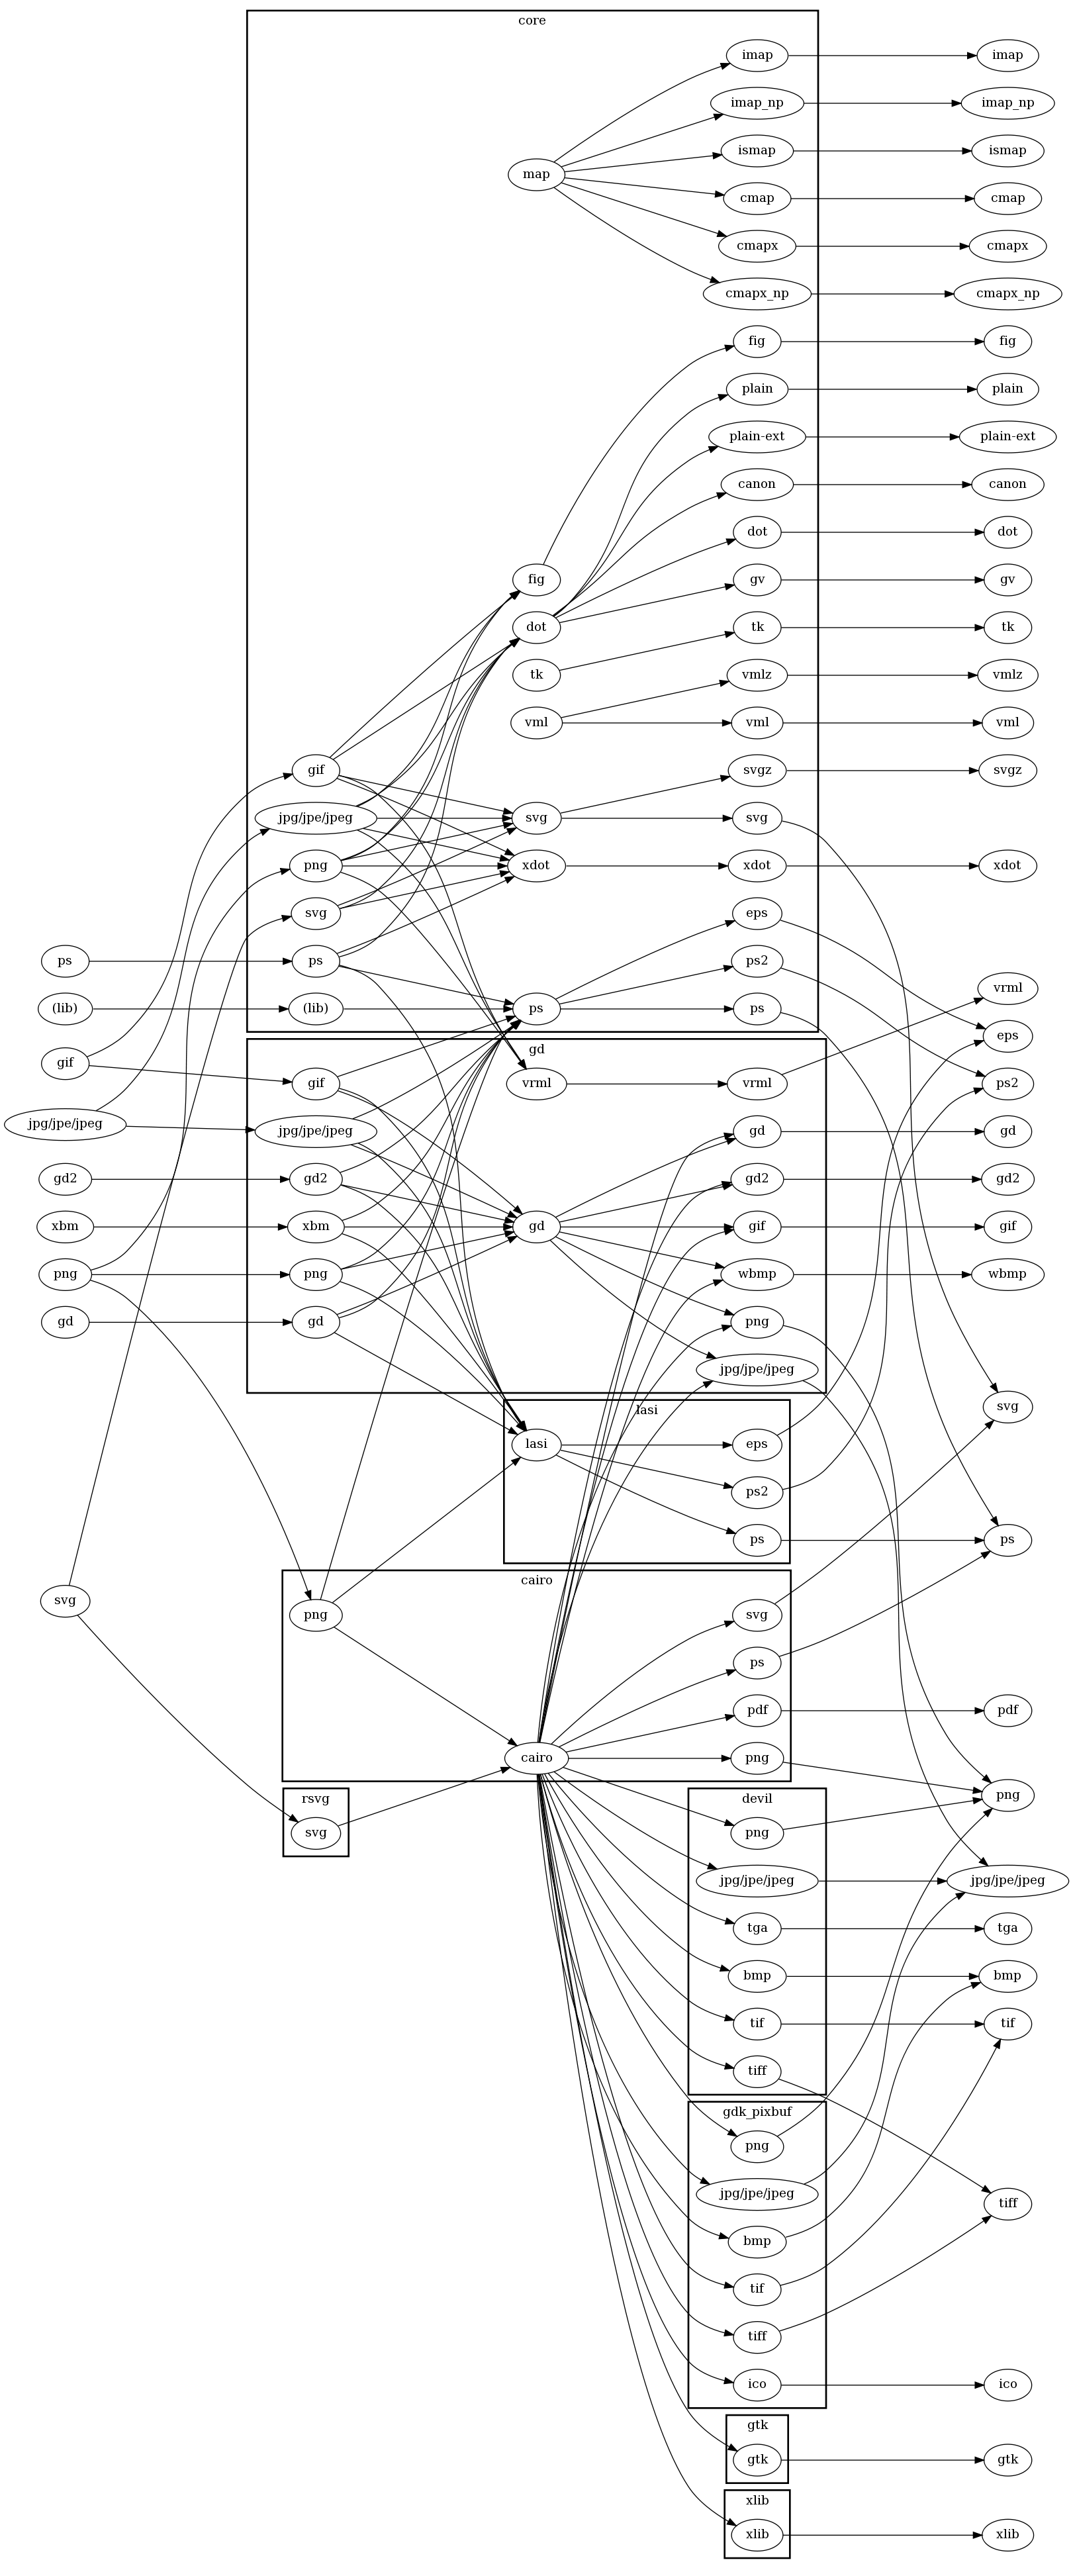
The graph below shows what image formats can be used in which output formats,
and the required plugins. On the left are the supported image formats.
On the right are the supported output formats.
In the middle are the plugins: image loaders, renderers, drivers, arranged by
plugin library.
This presents the most general case. A given installation may not provide
one of the plugins, in which case, that transformation is not possible.