library(tidyverse)01.1-methylation-explore
Bismark + was done on Hyak.
Genmome stats
kt <- read.csv("../data/Pver-karytotype.tab", header = FALSE, sep = "\t")knitr::kable(head(kt))| V1 | V2 |
|---|---|
| JAAVTL010000001.1 | 2095917 |
| JAAVTL010000002.1 | 2081954 |
| JAAVTL010000003.1 | 1617595 |
| JAAVTL010000004.1 | 1576134 |
| JAAVTL010000005.1 | 1560107 |
| JAAVTL010000006.1 | 1451149 |
There are 18268 scaffolds
nrow(kt)[1] 18268ggplot(kt, aes(x = V2)) +
geom_histogram(bins = 100) +
scale_x_log10()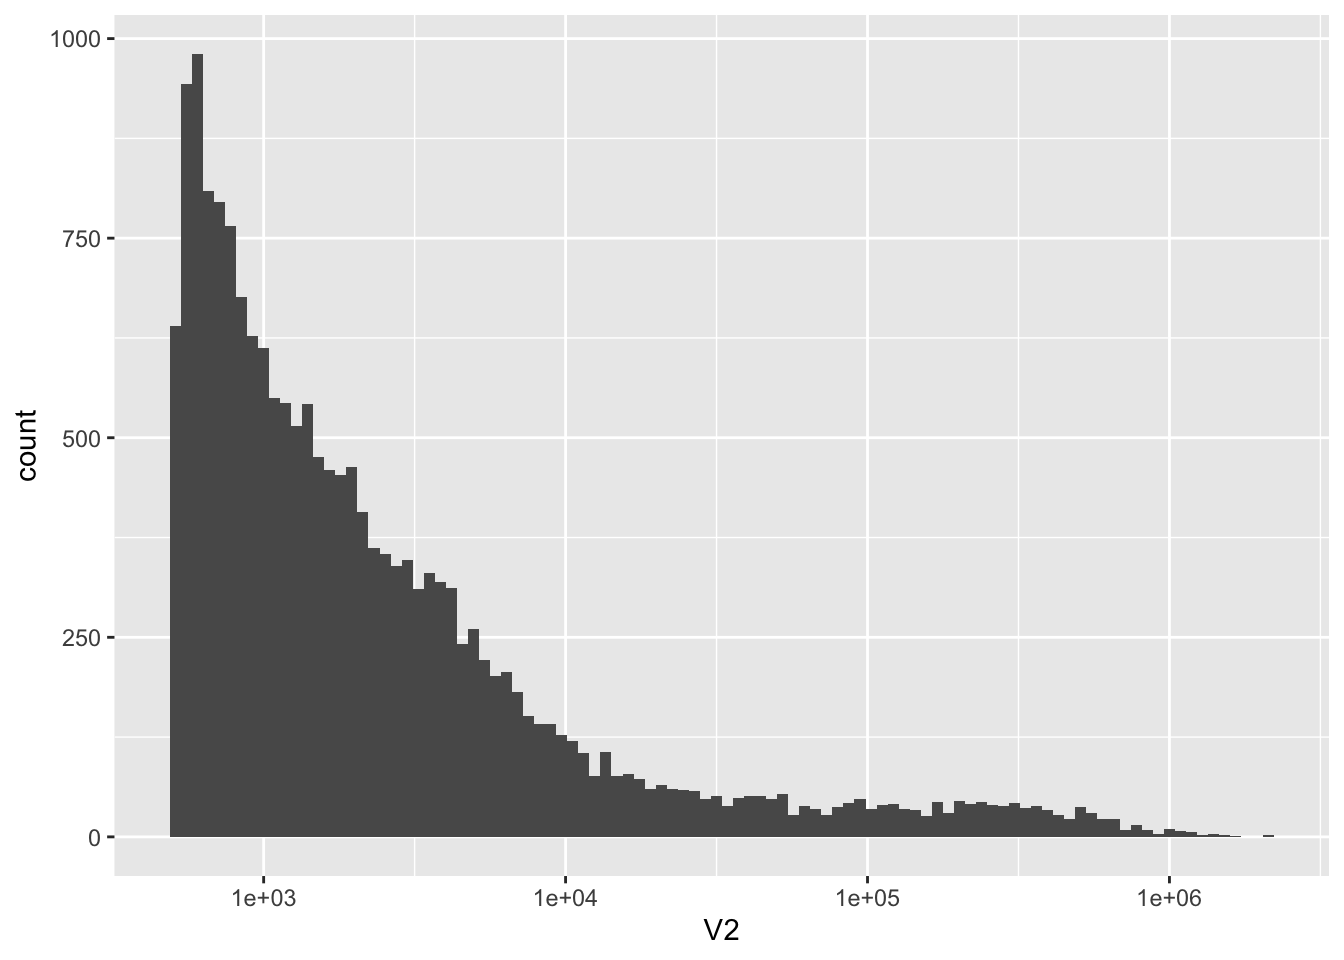
ggplot(kt, aes(x = V2)) +
  geom_histogram(bins = 100) +
  xlim(0, 5000)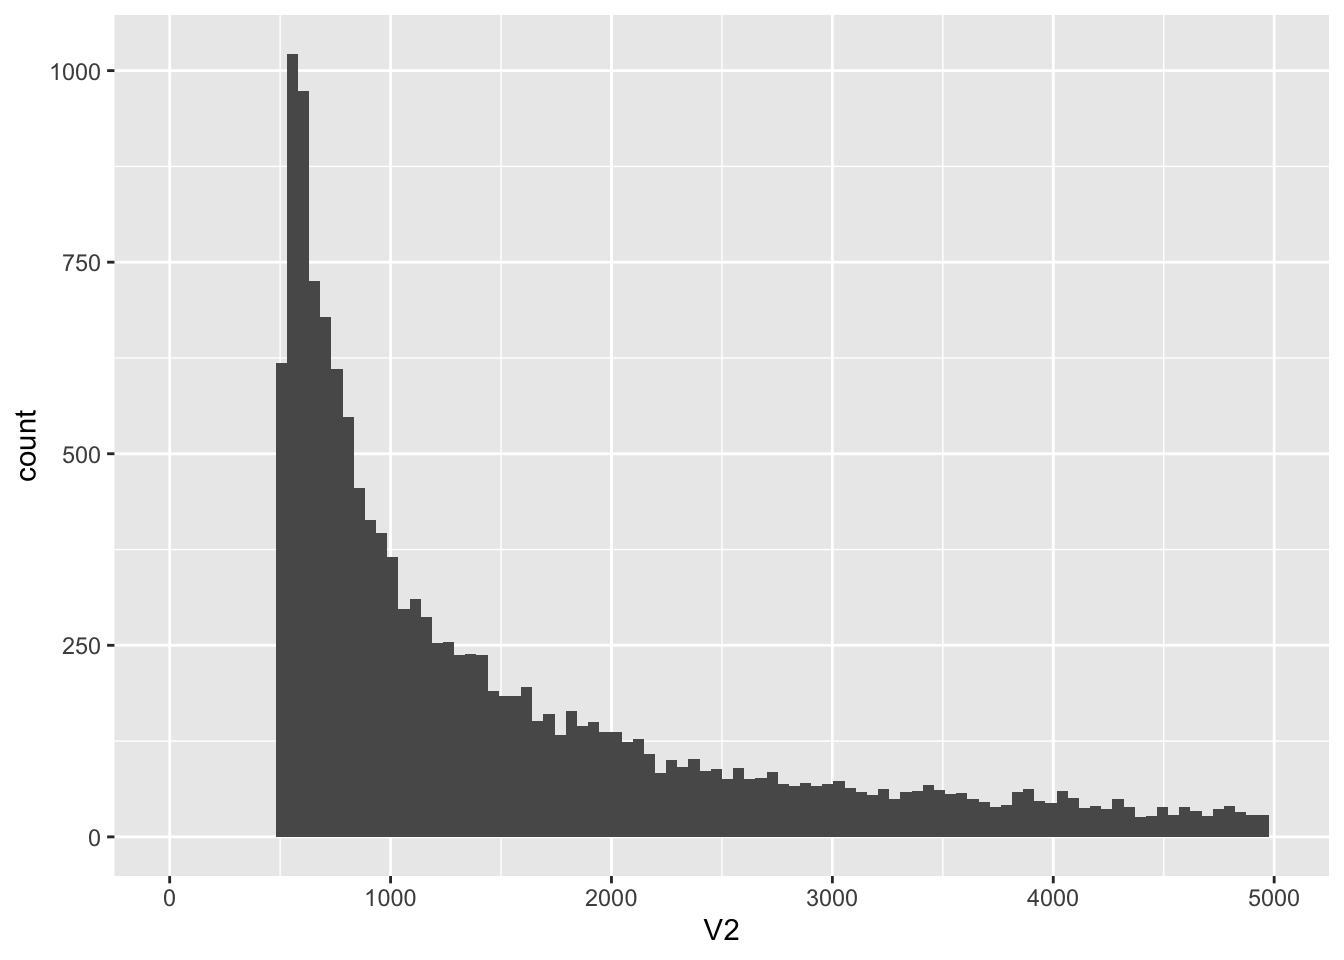
knitr::kable(kt %>% filter(V2 < 1000) %>% count())| n |
|---|
| 6544 |
First thing I want to do is do a simple histogram showing distribution of methylation levels. This will likely be done by taking 10 bedgraphs and concatenating then, making a histogram.
After that I would want to look at distribution across features..